SNAP income limits increased for 2026. A family of four can now earn up to $3,483 monthly and still qualify, while individuals can earn up to $1,696 monthly. Maximum benefits also rose to $994 monthly for four-person households and $298 for individuals.
Asset limits remain $3,000 for most households ($4,500 for elderly/disabled). Your home, one vehicle, and retirement accounts don’t count. The standard deduction increased to $209, helping more families qualify.
Effective October 1, 2025 through September 30, 2026. If you didn’t qualify before or received minimal benefits, consider reapplying.
This information is for the period of October 1, 2025, through September 30, 2026 (FY 2026).
1. Monthly Income Limits (Gross Income)
Most households must meet this Gross Income Test (130% of FPL).
Household Size
Max. Gross Monthly Income
1
$1,695
2
$2,292
3
$2,888
4
$3,483
5
$4,079
6
$4,675
Each Additional Member
+$595
2. Asset (Resource) Limits
Alabama uses state-specific limits for countable resources (cash, bank accounts, etc.).
Household Type
Max. Countable Assets
Standard Households
$2,750
Elderly/Disabled Households
$4,250
3. Net Income Test Exemption
Households that contain at least one member who is age 60 or older or is disabled only have to meet the Net Monthly Income Limit (100% FPL), and do not have to meet the Gross Income Limit listed above.
Alaska SNAP Gross Monthly Income Limits
Household Size
Max. Gross Monthly Income
1
$3,258
2
$4,406
3
$5,552
4
$6,698
5
$7,846
6
$8,992
Each Additional Member
+$1,146
Additional Key Information from the Alaska Website:
Gross Income Limit Basis: The gross income limit is set at 200% of the Federal Poverty Level (FPL).
Asset Limit:There is no asset limit in Alaska for most households, which is another area of expanded eligibility beyond the federal standard.
Elderly/Disabled Households: If a household with a member who is 60 or older or has a disability is over the gross income limit above, they can instead qualify by meeting the Net Income and federal Asset tests ($4,500 limit).
Arkansas SNAP Key Eligibility Details (FY 2026)
1. Gross Monthly Income Limits (130% FPL)
Household Size
Max. Gross Monthly Income
1
$1,695
2
$2,291
3
$2,887
4
$3,482
5
$4,079
6
$4,674
Each Additional Member
+$595
2. Asset (Resource) Limits
Household Type
Max. Countable Assets
Standard Households
$3,000
Elderly/Disabled Households
$4,500
3. Elderly/Disabled Exemptions:
Households with at least one member who is age 60 or older or is disabled have no gross income limit and only have to meet the Net Income and Asset tests.
You are correct to challenge the figures. I apologize for using slightly different data from a general search result instead of the exact website you provided. I have now used your provided link to get the figures.
Arizona SNAP Key Eligibility Details (FY 2026)
1. Gross Monthly Income Limits (185% FPL)
Arizona uses the 185% Federal Poverty Level (FPL) as the Gross Income limit for most households.
Household Size
Max. Gross Monthly Income
1
$2,412
2
$3,261
3
$4,108
4
$4,956
5
$5,805
6
$6,652
Each Additional Member
+$847
2. Asset (Resource) Limits
Arizona has expanded eligibility and does not have an asset (resource) test for most households.
Household Type
Max. Countable Assets
Standard Households
No Limit
Elderly/Disabled Households
No Limit
State-Specific Note:
Elderly/Disabled Households: If a household with an elderly (60+) or disabled member exceeds the high Gross Income limit, they can still qualify by meeting the standard Federal Net Income test and the Federal Asset test of $4,500.
California (CalFresh) Eligibility Summary (FY 2026)
1. Income Limits
California uses the highest Expanded Categorical Eligibility (ECE) standard (200% FPL) for Gross Income. The Net Income test is 100% FPL.
Household Size
Max. Gross Monthly Income (200% FPL)
Max. Net Monthly Income (100% FPL)
1
$2,608
$1,305
2
$3,526
$1,763
3
$4,442
$2,221
4
$5,358
$2,680
5
$6,276
$3,138
6
$7,192
$3,596
Each Additional Member
+$916
+$458
2. Special Rules for Elderly (60+) or Disabled Members
Eligibility Factor
Rule for Elderly/Disabled Households
Gross Income Test
EXEMPT. They are only required to meet the lower Net Income Test (100% FPL).
Asset Limit
NO LIMIT. California waives the resource test.
Deductions
Eligible for Medical Expense Deduction and Uncapped Shelter Deduction (for rent/utilities).
Colorado uses Broad-Based Categorical Eligibility (BBCE), setting the Gross Income limit at 200% of the Federal Poverty Level (FPL) for most households.
1. Income Limits (Effective Oct 1, 2025)
Household Size
Max. Gross Monthly Income (200% FPL)
Max. Net Monthly Income (100% FPL)
1
$2,608
$1,305
2
$3,526
$1,763
3
$4,442
$2,221
4
$5,358
$2,680
5
$6,276
$3,138
6
$7,192
$3,596
Each Additional Member
+$916
+$459
2. Asset (Resource) Limits
Colorado uses the federal asset limits for SNAP.
Household Type
Max. Countable Assets
Elderly (60+) or Disabled Households
$4,500
All Other Households
$3,000
3. Special Rules for Elderly (60+) or Disabled Members
Eligibility Factor
Rule for Elderly/Disabled Households
Income Test
While the 200% FPL Gross Income test generally applies, all households must also pass the Net Income Test (100% FPL) to determine final eligibility and benefit amount.
Deductions
Eligible for the Medical Expense Deduction (expenses over $35/month) and the Uncapped Shelter Deduction, which help lower the Net Income to meet the limit.
Connecticut SNAP Eligibility (Oct. 1, 2025 through Sept. 30, 2026)
Gross Monthly Income Limits (200% of FPL)
Household Size
Maximum Gross Monthly Income
1
$2,608
2
$3,526
3
$4,442
4
$5,358
5
$6,276
6
$7,192
Each Additional Member
+$916
Asset / Resource Limit
Household Type
Maximum Countable Assets
All Households
No asset limit in Connecticut.
Extra Note on Elderly and Disabled
Gross Income Waiver: If a household member is age 60 or older or has a disability, the household may still qualify even if their gross income is over the limit by meeting the federal Net Income and Asset tests.
Asset Limit: If qualifying under the alternative federal rules mentioned above, the countable asset limit is $4,500.
Deductions: These households can deduct out-of-pocket medical expenses that exceed $35 per month.
Note: Vehicles and homes are generally not counted as resources/assets.
District of Columbia SNAP Eligibility (Oct. 1, 2025 through Sept. 30, 2026)
Gross Monthly Income Limits (200% of FPL)
Household Size
Maximum Gross Monthly Income
1
$2,608
2
$3,526
3
$4,442
4
$5,358
5
$6,276
6
$7,192
Each Additional Member
+$916
Asset / Resource Limit
Household Type
Maximum Countable Assets
All Households
No asset limit in D.C.
Extra Note on Elderly and Disabled
Gross Income Waiver: If a household member is age 60 or older or has a disability, the household may still qualify even if their gross income is over the limit by instead meeting the federal Net Income and Asset tests.
Asset Limit: If qualifying under the alternative federal rules mentioned above, the countable asset limit is $4,500.
Deductions: These households can deduct out-of-pocket medical expenses that exceed $35 per month.
Note: Homes and vehicles are not counted as resources/assets.
Delaware SNAP Eligibility (Oct. 1, 2025 through Sept. 30, 2026)
Gross Monthly Income Limits (200% of FPL)
Household Size
Maximum Gross Monthly Income
1
$2,608
2
$3,526
3
$4,442
4
$5,358
5
$6,276
6
$7,192
Each Additional Member
+$916
Asset / Resource Limit
Household Type
Maximum Countable Assets
All Households
No asset limit in Delaware.
Extra Note on Elderly and Disabled
Gross Income Waiver: If a household member is age 60 or older or has a disability, the household may still qualify even if their gross income is over the limit by instead meeting the federal Net Income and Asset tests.
Asset Limit: If qualifying under the alternative federal rules mentioned above, the countable asset limit is $4,500.
Deductions: These households can deduct out-of-pocket medical expenses that exceed $35 per month.
Vehicles: Income-producing vehicles are not counted. For all other vehicles, only the value exceeding $4,650 is counted as a resource.
Florida SNAP Eligibility (Oct. 1, 2025 through Sept. 30, 2026)
Gross Monthly Income Limits (200% of FPL)
Household Size
Maximum Gross Monthly Income
1
$2,608
2
$3,526
3
$4,442
4
$5,358
5
$6,276
6
$7,192
Each Additional Member
+$916
Asset / Resource Limit
Household Type
Maximum Countable Assets
All Households
No asset limit in Florida.
Extra Note on Elderly and Disabled
Gross Income Waiver: If a household member is age 60 or older or has a disability, the household may still qualify even if their gross income exceeds the limit, provided they meet the federal Net Income and Asset tests.
Asset Limit: If qualifying under the alternative federal rules mentioned above, the countable asset limit is $4,500.
Deductions: These households can deduct out-of-pocket medical expenses that exceed $35 per month.
Note: Homes and vehicles are not counted as resources/assets.
Georgia SNAP Eligibility (Oct. 1, 2025 through Sept. 30, 2026)
Gross Monthly Income Limits
Household Size
Maximum Gross Monthly Income (Most Households – 130% FPL)
Expanded Income Limit (If ALL Adults are 60+ or Disabled – 200% FPL)
1
$1,695
$2,608
2
$2,291
$3,526
3
$2,887
$4,442
4
$3,482
$5,358
5
$4,079
$6,276
6
$4,674
$7,192
Each Additional Member
+$595
+$916
Asset / Resource Limit
Household Type
Maximum Countable Assets
All Households
No asset limit in Georgia.
Extra Note on Elderly and Disabled
Gross Income Requirement: Households with any member who is age 60 or older or has a disability only have to meet the standard Gross Income Test (130% FPL column above) if their countable assets are over $4,500.
Asset Limit Exception: While Georgia has no general asset limit, if an elderly or disabled household does not pass the Gross Income Test, they can alternatively qualify under the federal rules, which have an asset limit of $4,500.
Expanded Income Limit: Households where all adult members are 60 or older or have a disability, and who do not meet the asset test, may qualify under the higher 200% FPL limit (Expanded Income Limit column above).
Medical Expense Deduction: These households can deduct out-of-pocket medical expenses that exceed $35 per month. Alternatively, a standard medical deduction of $136 can be used if they have expenses over $35 (without full verification).
Note: Homes and vehicles are not counted as resources/assets.
Guam SNAP Eligibility (Oct. 1, 2025 through Sept. 30, 2026)
Gross Monthly Income Limits (165% of FPL)
Household Size
Maximum Gross Monthly Income
1
$2,151
2
$2,908
3
$3,664
4
$4,420
5
$5,177
6
$5,933
Each Additional Member
+$755
Asset / Resource Limit
Household Type
Maximum Countable Assets
All Households
No asset limit in Guam.
Extra Note on Elderly and Disabled
Gross Income Waiver: If a household member is age 60 or older or has a disability, the household may still qualify even if their gross income exceeds the limit, provided they meet the federal Net Income and Asset tests.
Asset Limit: If qualifying under the alternative federal rules mentioned above, the countable asset limit is $4,500.
Deductions: These households can deduct out-of-pocket medical expenses that exceed $35 per month.
Vehicles: A home is not counted. One vehicle per parent in a household with children, and income-producing vehicles, is not counted. For all other vehicles, only the value exceeding $4,650 is counted.
Hawaii SNAP Eligibility (Oct. 1, 2025 through Sept. 30, 2026)
Gross Monthly Income Limits (200% of FPL)
Household Size
Maximum Gross Monthly Income
1
$2,998
2
$4,054
3
$5,108
4
$6,164
5
$7,218
6
$8,274
Each Additional Member
+$1,056
Asset / Resource Limit
Household Type
Maximum Countable Assets
All Households
No asset limit in Hawaii.
Extra Note on Elderly and Disabled
Gross Income Waiver: If a household member is age 60 or older or has a disability, the household may still qualify even if their gross income is over the limit by instead meeting the federal Net Income and Asset tests.
Asset Limit: If qualifying under the alternative federal rules mentioned above, the countable asset limit is $4,500.
Deductions: These households can deduct out-of-pocket medical expenses that exceed $35 per month.
Note: Homes and vehicles are not counted as resources/assets.
Iowa SNAP Eligibility (Oct. 1, 2025 through Sept. 30, 2026)
Gross Monthly Income Limits (160% of FPL)
Household Size
Maximum Gross Monthly Income
1
$2,086
2
$2,820
3
$3,553
4
$4,286
5
$5,020
6
$5,753
Each Additional Member
+$732
Asset / Resource Limit
Household Type
Maximum Countable Assets
All Households
No asset limit in Iowa.
Extra Note on Elderly and Disabled
Gross Income Waiver: If a household member is age 60 or older or has a disability, the household may still qualify even if their gross income is over the limit by instead meeting the federal Net Income and Asset tests.
Asset Limit: If qualifying under the alternative federal rules mentioned above, the countable asset limit is $4,500.
Deductions: These households can deduct out-of-pocket medical expenses that exceed $35 per month. Alternatively, a standard medical deduction of $125 can be used if they have expenses over $35 (without full verification).
Vehicles: A home is not counted. One household vehicle and any income-producing vehicles are not counted. For all other vehicles, only the value exceeding $4,650 is counted.
Idaho SNAP Eligibility (Oct. 1, 2025 through Sept. 30, 2026)
Gross Monthly Income Limits
Household Size
Maximum Gross Monthly Income (Most Households – 130% FPL)
1
$1,695
2
$2,291
3
$2,887
4
$3,482
5
$4,079
6
$4,674
Each Additional Member
+$595
Asset / Resource Limit
Household Type
Maximum Countable Assets
All Households
$5,000
Extra Note on Elderly and Disabled
Gross Income Waiver: There is no gross income limit in Idaho for households with a member who is age 60 or older or has a disability.
Net Income Test: These households still must meet the Net Income Test (100% of FPL) if their gross income is over 130% of the federal poverty level.
Deductions: These households can deduct out-of-pocket medical expenses that exceed $35 per month. Alternatively, a standard medical deduction of $144 can be used if they have expenses over $35 (without full verification).
Vehicles: A home is not counted. One vehicle per adult and any income-producing vehicles are not counted. For all other vehicles, only the value exceeding $4,650 is counted.
Illinois SNAP Eligibility (Oct. 1, 2025 through Sept. 30, 2026)
Gross Monthly Income Limits
Household Size
Maximum Gross Monthly Income (Most Households – 165% FPL)
Expanded Income Limit (If Any Member is 60+ or Disabled – 200% FPL)
1
$2,151
$2,608
2
$2,908
$3,526
3
$3,664
$4,442
4
$4,420
$5,358
5
$5,177
$6,276
6
$5,933
$7,192
Each Additional Member
+$755
+$916
Asset / Resource Limit
Household Type
Maximum Countable Assets
All Households
No asset limit in Illinois.
Extra Note on Elderly and Disabled
Expanded Income Limit: If a household has a member who is age 60 or older or has a disability, they may qualify under the higher 200% FPL limit if they do not meet the federal asset limit ($4,500).
Asset Limit Exception: While Illinois has no general asset limit, if an elderly or disabled household is over the standard 165% Gross Income Limit, they can alternatively qualify under the federal program rules, which have an asset limit of $4,500.
Medical Expense Deduction: These households can deduct out-of-pocket medical expenses that exceed $35 per month. Alternatively, a standard medical deduction of $185 can be used if they have expenses over $35 (without full verification).
Note: Homes and vehicles are not counted as resources/assets.
Indiana SNAP Eligibility (Oct. 1, 2025 through Sept. 30, 2026)
Gross Monthly Income Limits
Household Size
Maximum Gross Monthly Income (Most Households – 130% FPL)
1
$1,695
2
$2,291
3
$2,887
4
$3,482
5
$4,079
6
$4,674
Each Additional Member
+$595
Asset / Resource Limit
Household Type
Maximum Countable Assets
All Households
$5,000
Extra Note on Elderly and Disabled
Gross Income Waiver: There is no gross income limit in Indiana for households with a member who is age 60 or older or has a disability.
Net Income Test: Households with an elderly or disabled member still must meet the Net Income Test (100% of FPL).
Deductions: These households can deduct out-of-pocket medical expenses that exceed $35 per month.
Vehicles: A home is not counted. Most vehicles are not counted as resources, including those used for work or family transportation.
Kansas SNAP Eligibility (Oct. 1, 2025 through Sept. 30, 2026)
Gross Monthly Income Limits (130% of FPL)
Household Size
Maximum Gross Monthly Income
1
$1,695
2
$2,291
3
$2,887
4
$3,482
5
$4,079
6
$4,674
Each Additional Member
+$595
Asset / Resource Limit
Household Type
Maximum Countable Assets
Households with a member 60+ or disabled
$4,500
All other households
$3,000
Extra Note on Elderly and Disabled
Gross Income Waiver: There is no gross income limit in Kansas for households with a member who is age 60 or older or has a disability.
Net Income Test: Households with an elderly or disabled member still must meet the Net Income Test (100% of FPL).
Asset Limit: These households have a higher asset limit of $4,500.
Deductions: These households can deduct out-of-pocket medical expenses that exceed $35 per month. Alternatively, a standard medical deduction of $175 can be used if they have expenses over $35 (without full verification).
Vehicles: A home is not counted. One vehicle per adult and any income-producing vehicles are not counted. For all other vehicles, only the value exceeding $4,650 is counted.
Kentucky SNAP Eligibility (Oct. 1, 2025 through Sept. 30, 2026)
Gross Monthly Income Limits (200% of FPL)
Household Size
Maximum Gross Monthly Income
1
$2,608
2
$3,526
3
$4,442
4
$5,358
5
$6,276
6
$7,192
Each Additional Member
+$916
Asset / Resource Limit
Household Type
Maximum Countable Assets
All Households
No asset limit in Kentucky.
Extra Note on Elderly and Disabled
Gross Income Waiver: If a household member is age 60 or older or has a disability, the household may still qualify even if their gross income is over the limit by instead meeting the federal Net Income and Asset tests.
Asset Limit: If qualifying under the alternative federal rules mentioned above, the countable asset limit is $4,500.
Deductions: These households can deduct out-of-pocket medical expenses that exceed $35 per month. Alternatively, a standard medical deduction of $137 can be used if they have expenses over $35 (without full verification).
Note: Homes and vehicles are not counted as resources/assets.
Louisiana SNAP Eligibility (Oct. 1, 2025 through Sept. 30, 2026)
Gross Monthly Income Limits (200% of FPL)
Household Size
Maximum Gross Monthly Income
1
$2,608
2
$3,526
3
$4,442
4
$5,358
5
$6,276
6
$7,192
Each Additional Member
+$916
Asset / Resource Limit
Household Type
Maximum Countable Assets
All Households
No asset limit in Louisiana.
Extra Note on Elderly and Disabled
Gross Income Waiver: If a household member is age 60 or older or has a disability, the household may still qualify even if their gross income is over the limit by instead meeting the federal Net Income and Asset tests.
Asset Limit: If qualifying under the alternative federal rules mentioned above, the countable asset limit is $4,500.
Deductions: These households can deduct out-of-pocket medical expenses that exceed $35 per month. Alternatively, a standard medical deduction of $161 can be used if they have expenses over $35 (without full verification).
Note: Homes and vehicles are not counted as resources/assets.
Massachusetts SNAP Eligibility (Oct. 1, 2025 through Sept. 30, 2026)
Gross Monthly Income Limits (200% of FPL)
Household Size
Maximum Gross Monthly Income
1
$2,608
2
$3,526
3
$4,442
4
$5,358
5
$6,276
6
$7,192
Each Additional Member
+$916
Asset / Resource Limit
Household Type
Maximum Countable Assets
All Households
No asset limit in Massachusetts.
Extra Note on Elderly and Disabled
Gross Income Waiver: If a household member is age 60 or older or has a disability, the household may still qualify even if their gross income is over the limit by instead meeting the federal Net Income and Asset tests.
Asset Limit: If qualifying under the alternative federal rules mentioned above, the countable asset limit is $4,500.
Deductions: These households can deduct out-of-pocket medical expenses that exceed $35 per month. Alternatively, a standard medical deduction of $155 can be used if they have expenses over $35 (without full verification).
Note: Homes and vehicles are not counted as resources/assets.
Maryland SNAP Eligibility (Oct. 1, 2025 through Sept. 30, 2026)
Gross Monthly Income Limits (200% of FPL)
Household Size
Maximum Gross Monthly Income
1
$2,608
2
$3,526
3
$4,442
4
$5,358
5
$6,276
6
$7,192
Each Additional Member
+$916
Asset / Resource Limit
Household Type
Maximum Countable Assets
All Households
No asset limit in Maryland.
Extra Note on Elderly and Disabled
Gross Income Waiver: If a household member is age 60 or older or has a disability, the household may still qualify even if their gross income exceeds the limit, provided they meet the federal Net Income and Asset tests.
Asset Limit: If qualifying under the alternative federal rules mentioned above, the countable asset limit is $4,500.
Deductions: These households can deduct out-of-pocket medical expenses that exceed $35 per month.
Minimum Benefit: If anyone in the household is over 60, the minimum monthly benefit is $50.
Note: Homes and vehicles are not counted as resources/assets.
Maine SNAP Eligibility (Oct. 1, 2025 through Sept. 30, 2026)
Gross Monthly Income Limits (200% of FPL)
Household Size
Maximum Gross Monthly Income
1
$2,608
2
$3,526
3
$4,442
4
$5,358
5
$6,276
6
$7,192
Each Additional Member
+$916
Asset / Resource Limit
Household Type
Maximum Countable Assets
All Households
No asset limit in Maine.
Extra Note on Elderly and Disabled
Gross Income Waiver: If a household member is age 60 or older or has a disability, the household may still qualify even if their gross income exceeds the limit, provided they meet the federal Net Income and Asset tests.
Asset Limit: If qualifying under the alternative federal rules mentioned above, the countable asset limit is $4,500.
Deductions: These households can deduct out-of-pocket medical expenses that exceed $35 per month.
Vehicles: A home is not counted. One household vehicle and any income-producing vehicles are not counted. For all other vehicles, only the value exceeding $4,650 is counted.
Michigan SNAP Eligibility (Oct. 1, 2025 through Sept. 30, 2026)
Gross Monthly Income Limits (200% of FPL)
Household Size
Maximum Gross Monthly Income
1
$2,608
2
$3,526
3
$4,442
4
$5,358
5
$6,276
6
$7,192
Each Additional Member
+$916
Asset / Resource Limit
Household Type
Maximum Countable Assets
All Households
No asset limit in Michigan.
Extra Note on Elderly and Disabled
Gross Income Waiver: If a household member is age 60 or older or has a disability, the household may still qualify even if their gross income exceeds the limit, provided they meet the federal Net Income and Asset tests.
Asset Limit: If qualifying under the alternative federal rules mentioned above, the countable asset limit is $4,500.
Deductions: These households can deduct out-of-pocket medical expenses that exceed $35 per month. Alternatively, a standard medical deduction of $165 can be used if expenses exceed $35 (without full verification).
Note: Homes and vehicles are not counted as resources/assets.
Minnesota SNAP Eligibility (Oct. 1, 2025 through Sept. 30, 2026)
Gross Monthly Income Limits
Household Size
Maximum Gross Monthly Income (Most Households – 200% FPL)
1
$2,608
2
$3,526
3
$4,442
4
$5,358
5
$6,276
6
$7,192
Each Additional Member
+$916
Asset / Resource Limit
Household Type
Maximum Countable Assets
All Households
No asset limit in Minnesota.
Extra Note on Elderly and Disabled
Gross Income Waiver: There is no gross income limit in Minnesota for households with a member who is age 60 or older or has a disability.
Net Income Test: These households still must meet the Net Income Test (100% of FPL) only if their gross income is over 200% of the federal poverty level.
Deductions: These households can deduct out-of-pocket medical expenses that exceed $35 per month.
Note: Homes and vehicles are not counted as resources/assets.
Missouri SNAP Eligibility (Oct. 1, 2025 through Sept. 30, 2026)
Gross Monthly Income Limits (130% of FPL)
Household Size
Maximum Gross Monthly Income
1
$1,695
2
$2,291
3
$2,887
4
$3,482
5
$4,079
6
$4,674
Each Additional Member
+$595
Asset / Resource Limit
Household Type
Maximum Countable Assets
Households with a member 60+ or disabled
$4,500
All other households
$3,000
Extra Note on Elderly and Disabled
Gross Income Waiver: There is no gross income limit in Missouri for households with a member who is age 60 or older or has a disability.
Net Income Test: These households still must meet the Net Income Test (100% of FPL).
Asset Limit: These households have a higher asset limit of $4,500.
Deductions: These households can deduct out-of-pocket medical expenses that exceed $35 per month. Alternatively, a standard medical deduction of $135 can be used if expenses exceed $35 (without full verification).
Note: Homes and vehicles are not counted as resources/assets.
Mississippi SNAP Eligibility (Oct. 1, 2025 through Sept. 30, 2026)
Gross Monthly Income Limits (130% of FPL)
Household Size
Maximum Gross Monthly Income
1
$1,695
2
$2,291
3
$2,887
4
$3,482
5
$4,079
6
$4,674
Each Additional Member
+$595
Asset / Resource Limit
Household Type
Maximum Countable Assets
Households with a member 60+ or disabled
$4,500
All other households
$3,000
Extra Note on Elderly and Disabled
Gross Income Waiver: There is no gross income limit in Mississippi for households with a member who is age 60 or older or has a disability.
Net Income Test: These households still must meet the Net Income Test (100% of FPL).
Asset Limit: These households have a higher asset limit of $4,500.
Deductions: These households can deduct out-of-pocket medical expenses that exceed $35 per month.
Note: Homes and vehicles are not counted as resources/assets.
Montana SNAP Eligibility (Oct. 1, 2025 through Sept. 30, 2026)
Gross Monthly Income Limits (200% of FPL)
Household Size
Maximum Gross Monthly Income
1
$2,608
2
$3,526
3
$4,442
4
$5,358
5
$6,276
6
$7,192
Each Additional Member
+$916
Asset / Resource Limit
Household Type
Maximum Countable Assets
All Households
No asset limit in Montana.
Extra Note on Elderly and Disabled
Gross Income Waiver: If a household member is age 60 or older or has a disability, the household may still qualify even if their gross income exceeds the limit, provided they meet the federal Net Income and Asset tests.
Asset Limit: If qualifying under the alternative federal rules mentioned above, the countable asset limit is $4,500.
Deductions: These households can deduct out-of-pocket medical expenses that exceed $35 per month.
Note: Homes and vehicles are not counted as resources/assets.
North Carolina SNAP Eligibility (Oct. 1, 2025 through Sept. 30, 2026)
Gross Monthly Income Limits (200% of FPL)
Household Size
Maximum Gross Monthly Income
1
$2,608
2
$3,526
3
$4,442
4
$5,358
5
$6,276
6
$7,192
Each Additional Member
+$916
Asset / Resource Limit
Household Type
Maximum Countable Assets
All Households
No asset limit in North Carolina.
Extra Note on Elderly and Disabled
Gross Income Waiver: If a household member is age 60 or older or has a disability, the household may still qualify even if their gross income is over the limit by instead meeting the federal Net Income and Asset tests.
Asset Limit: If qualifying under the alternative federal rules mentioned above, the countable asset limit is $4,500.
Deductions: These households can deduct out-of-pocket medical expenses that exceed $35 per month.
Note: Homes and vehicles are not counted as resources/assets.
North Dakota SNAP Eligibility (Oct. 1, 2025 through Sept. 30, 2026)
Gross Monthly Income Limits (200% of FPL)
Household Size
Maximum Gross Monthly Income
1
$2,608
2
$3,526
3
$4,442
4
$5,358
5
$6,276
6
$7,192
Each Additional Member
+$916
Asset / Resource Limit
Household Type
Maximum Countable Assets
All Households
No asset limit in North Dakota.
Extra Note on Elderly and Disabled
Gross Income Waiver: If a household member is age 60 or older or has a disability, the household may still qualify even if their gross income exceeds the limit, provided they meet the federal Net Income and Asset tests.
Asset Limit: If qualifying under the alternative federal rules mentioned above, the countable asset limit is $4,500.
Deductions: These households can deduct out-of-pocket medical expenses that exceed $35 per month. Alternatively, a standard medical deduction of $200 can be used if expenses exceed $35 (without full verification).
Vehicles: A home is not counted. Income-producing vehicles are not counted. For all other vehicles, only the value exceeding $4,650 is counted.
Nebraska SNAP Eligibility (Oct. 1, 2025 through Sept. 30, 2026)
Gross Monthly Income Limits (165% of FPL)
Household Size
Maximum Gross Monthly Income
1
$2,151
2
$2,908
3
$3,664
4
$4,420
5
$5,177
6
$5,933
Each Additional Member
+$755
Asset / Resource Limit
Household Type
Maximum Countable Assets
All Households
$25,000
Extra Note on Elderly and Disabled
Gross Income Waiver: There is no gross income limit in Nebraska for households with a member who is age 60 or older or has a disability.
Net Income Test: These households must meet the Net Income Test (100% of FPL) only if their gross income exceeds the standard 165% FPL limit.
Asset Limit: The asset limit for all households, including those with elderly or disabled members, is $25,000.
Deductions: These households can deduct out-of-pocket medical expenses that exceed $35 per month.
Note: Homes and vehicles are not counted as resources/assets.
New Hampshire SNAP Eligibility (Oct. 1, 2025 through Sept. 30, 2026)
Gross Monthly Income Limits (200% of FPL)
Household Size
Maximum Gross Monthly Income
1
$2,608
2
$3,526
3
$4,442
4
$5,358
5
$6,276
6
$7,192
Each Additional Member
+$916
Asset / Resource Limit
Household Type
Maximum Countable Assets
All Households
No asset limit in New Hampshire.
Extra Note on Elderly and Disabled
Gross Income Waiver: If a household member is age 60 or older or has a disability, the household may still qualify even if their gross income exceeds the limit, provided they meet the federal Net Income and Asset tests.
Asset Limit: If qualifying under the alternative federal rules mentioned above, the countable asset limit is $4,500.
Deductions: These households can deduct out-of-pocket medical expenses that exceed $35 per month. Alternatively, a standard medical deduction of $115 can be used if expenses exceed $35 (without full verification).
Vehicles: A home is not counted. One vehicle per adult, and any income-producing vehicles are not counted. For all other vehicles, only the value exceeding $4,650 is counted.
New Jersey SNAP Eligibility (Oct. 1, 2025 through Sept. 30, 2026)
Gross Monthly Income Limits (185% of FPL)
Household Size
Maximum Gross Monthly Income
1
$2,412
2
$3,261
3
$4,108
4
$4,956
5
$5,805
6
$6,652
Each Additional Member
+$847
Asset / Resource Limit
Household Type
Maximum Countable Assets
All Households
No asset limit in New Jersey.
Extra Note on Elderly and Disabled
Gross Income Waiver: If a household member is age 60 or older or has a disability, the household may still qualify even if their gross income exceeds the limit, provided they meet the federal Net Income and Asset tests.
Asset Limit: If qualifying under the alternative federal rules mentioned above, the countable asset limit is $4,500.
Deductions: These households can deduct out-of-pocket medical expenses that exceed $35 per month.
Note: Homes and vehicles are not counted as resources/assets.
New Mexico SNAP Eligibility (Oct. 1, 2025 through Sept. 30, 2026)
Gross Monthly Income Limits (200% of FPL)
Household Size
Maximum Gross Monthly Income
1
$2,608
2
$3,526
3
$4,442
4
$5,358
5
$6,276
6
$7,192
Each Additional Member
+$916
Asset / Resource Limit
Household Type
Maximum Countable Assets
All Households
No asset limit in New Mexico.
Extra Note on Elderly and Disabled
Gross Income Waiver: If a household member is age 60 or older or has a disability, the household may still qualify even if their gross income is over the limit by instead meeting the federal Net Income and Asset tests.
Asset Limit: If qualifying under the alternative federal rules mentioned above, the countable asset limit is $4,500.
Deductions: These households can deduct out-of-pocket medical expenses that exceed $35 per month.
Minimum Benefit: If everyone in the household is over 60 or has a disability and the household has no earned income, the minimum benefit is $100.
Note: Homes and vehicles are not counted as resources/assets.
Nevada SNAP Eligibility (Oct. 1, 2025 through Sept. 30, 2026)
Gross Monthly Income Limits (200% of FPL)
Household Size
Maximum Gross Monthly Income
1
$2,608
2
$3,526
3
$4,442
4
$5,358
5
$6,276
6
$7,192
Each Additional Member
+$916
Asset / Resource Limit
Household Type
Maximum Countable Assets
All Households
No asset limit in Nevada.
Extra Note on Elderly and Disabled
Gross Income Waiver: If a household member is age 60 or older or has a disability, the household may still qualify even if their gross income exceeds the limit, provided they meet the federal Net Income and Asset tests.
Asset Limit: If qualifying under the alternative federal rules mentioned above, the countable asset limit is $4,500.
Deductions: These households can deduct out-of-pocket medical expenses that exceed $35 per month.
Vehicles: A home is not counted. One household vehicle and any income-producing vehicles are not counted. For all other vehicles, only the value exceeding $4,650 is counted.
Note: Homes and vehicles are not counted as resources/assets under the standard broad-based categorical eligibility (BBCE) rules.
New York SNAP Eligibility (Oct. 1, 2025 through Sept. 30, 2026)
Gross Monthly Income Limits (Highest Tier – 200% of FPL)
This limit applies to households with a Dependent Child or those with a member 60 or Older/Disabled (if they do not pass the federal asset test).
Household Size
Maximum Gross Monthly Income
1
$2,608
2
$3,526
3
$4,442
4
$5,358
5
$6,276
6
$7,192
Each Additional Member
+$916
Note on Other Income Tiers: Lower gross income limits apply to other households (e.g., 150% FPL if only earned income, 130% FPL if no earned income, dependent child, or elderly/disabled member).
Asset / Resource Limit
Household Type
Maximum Countable Assets
All Households
No asset limit in New York.
Extra Note on Elderly and Disabled
Gross Income Limit: The highest gross income limit is 200% of FPL.
Alternative Qualification: If their gross income exceeds the limit above, they may still qualify by meeting the federal Net Income Test (100% FPL) and a federal Asset Test with a countable asset limit of $4,500.
Deductions: These households can deduct out-of-pocket medical expenses that exceed $35 per month.
Vehicles: A home is not counted. One vehicle per adult and any income-producing vehicles are not counted. For all other vehicles, only the value exceeding $4,650 is counted.
Ohio SNAP Eligibility (Oct. 1, 2025 through Sept. 30, 2026)
Gross Monthly Income Limits (200% of FPL)
Household Size
Maximum Gross Monthly Income
1
$2,608
2
$3,526
3
$4,442
4
$5,358
5
$6,276
6
$7,192
Each Additional Member
+$916
Asset / Resource Limit
Household Type
Maximum Countable Assets
All Households
No asset limit in Ohio.
Extra Note on Elderly and Disabled
Gross Income Waiver: If a household member is age 60 or older or has a disability, the household may still qualify even if their gross income is over the limit by instead meeting the federal Net Income and Asset tests.
Asset Limit: If qualifying under the alternative federal rules mentioned above, the countable asset limit is $4,500.
Deductions: These households can deduct out-of-pocket medical expenses that exceed $35 per month.
Note: Homes and vehicles are not counted as resources/assets.
Oklahoma SNAP Eligibility (Oct. 1, 2025 through Sept. 30, 2026)
Gross Monthly Income Limits (130% of FPL)
Household Size
Maximum Gross Monthly Income
1
$1,695
2
$2,291
3
$2,887
4
$3,482
5
$4,079
6
$4,674
Each Additional Member
+$595
Asset / Resource Limit
Household Type
Maximum Countable Assets
All Households
No asset limit in Oklahoma.
Extra Note on Elderly and Disabled
Gross Income Waiver: There is no gross income limit in Oklahoma for households with a member who is age 60 or older or has a disability.
Net Income Test: These households must still meet the Net Income Test (100% of FPL) if their gross income is over the standard 130% FPL limit.
Asset Limit: The asset limit is No asset limit.
Deductions: These households can deduct out-of-pocket medical expenses that exceed $35 per month.
Note: Homes and vehicles are not counted as resources/assets.
Oregon SNAP Eligibility (Oct. 1, 2025 through Sept. 30, 2026)
Gross Monthly Income Limits (200% of FPL)
Household Size
Maximum Gross Monthly Income
1
$2,608
2
$3,526
3
$4,442
4
$5,358
5
$6,276
6
$7,192
Each Additional Member
+$916
Asset / Resource Limit
Household Type
Maximum Countable Assets
All Households
No asset limit in Oregon.
Extra Note on Elderly and Disabled
Gross Income Waiver: If a household member is age 60 or older or has a disability, the household may still qualify even if their gross income exceeds the limit, provided they meet the federal Net Income and Asset tests.
Asset Limit (Alternative): If qualifying under the alternative federal rules mentioned above, the countable asset limit is $4,500.
Deductions: These households can deduct out-of-pocket medical expenses that exceed $35 per month. Alternatively, a standard medical deduction of $170 can be used if expenses exceed $35 (without full verification).
Vehicles: A home is not counted. Only equity in vehicles above $10,000 is counted.
Note: Court-ordered child support payments are excluded from gross income.
Pennsylvania SNAP Eligibility (Oct. 1, 2025 through Sept. 30, 2026)
Gross Monthly Income Limits (200% of FPL)
Household Size
Maximum Gross Monthly Income
1
$2,608
2
$3,526
3
$4,442
4
$5,358
5
$6,276
6
$7,192
Each Additional Member
+$916
Asset / Resource Limit
Household Type
Maximum Countable Assets
All Households
No asset limit in Pennsylvania.
Extra Note on Elderly and Disabled
Gross Income Waiver: If a household member is age 60 or older or has a disability, the household may still qualify even if their gross income exceeds the limit, provided they meet the federal Net Income and Asset tests.
Asset Limit (Alternative): If qualifying under the alternative federal rules mentioned above, the countable asset limit is $4,500.
Deductions: These households can deduct out-of-pocket medical expenses that exceed $35 per month.
Vehicles: A home is not counted. One household vehicle and any income-producing vehicles are not counted. For all other vehicles, only the value exceeding $4,650 is counted.
Note: Homes and vehicles are not counted as resources/assets under the standard broad-based categorical eligibility (BBCE) rules.
South Carolina SNAP Eligibility (Oct. 1, 2025 through Sept. 30, 2026)
Gross Monthly Income Limits
There are two income tiers based on the household composition:
Household Size
Max Gross Monthly Income (Standard – 130% of FPL)
Max Gross Monthly Income (Elderly/Disabled Adults – 200% of FPL)
1
$1,695
$2,608
2
$2,291
$3,526
3
$2,887
$4,442
4
$3,482
$5,358
5
$4,079
$6,276
6
$4,674
$7,192
Each Additional Member
+$595
+$916
Asset / Resource Limit
Household Type
Maximum Countable Assets
All Households
No asset limit in South Carolina.
Extra Note on Elderly and Disabled
Gross Income Tiers:
Households where all adult members are age 60 or older or have a disability, and who do not meet the federal asset test, use the 200% FPL limits (right column above).
Households with any member who is 60 or older or has a disability only have to meet the 130% FPL Gross Income Test if they have over $4,500 in assets.
Asset Limit (Alternative): If qualifying under the federal rules (e.g., due to high income/assets), the countable asset limit is $4,500.
Deductions: These households can deduct out-of-pocket medical expenses that exceed $35 per month. Alternatively, a standard medical deduction of $175 can be used if expenses exceed $35 (without full verification).
Vehicles: A home is not counted. One vehicle per driver in the household, and any income-producing vehicles are not counted. For all other vehicles, only the value exceeding $4,650 is counted.
Note: Homes and vehicles are not counted as resources/assets under the standard broad-based categorical eligibility (BBCE) rules.
Rhode Island SNAP Eligibility (Oct. 1, 2025 through Sept. 30, 2026)
Gross Monthly Income Limits
The income limit depends on the presence of elderly/disabled members:
Household Size
Max Gross Monthly Income (Standard – 185% of FPL)
Max Gross Monthly Income (Elderly/Disabled – 200% of FPL)
1
$2,412
$2,608
2
$3,261
$3,526
3
$4,108
$4,442
4
$4,956
$5,358
5
$5,805
$6,276
6
$6,652
$7,192
Each Additional Member
+$847
+$916
Asset / Resource Limit
Household Type
Maximum Countable Assets
All Households
No asset limit in Rhode Island.
Extra Note on Elderly and Disabled
Gross Income Tiers: Households with any member who is age 60 or older or has a disability can use the higher 200% FPL limit (right column above).
Alternative Qualification: If their gross income exceeds the 200% FPL limit, they may still qualify by meeting the federal Net Income Test (100% FPL) and a federal Asset Test with a countable asset limit of $4,500.
Deductions: These households can deduct out-of-pocket medical expenses that exceed $35 per month. Alternatively, a standard medical deduction of $183 can be used if expenses exceed $35 (without full verification).
Vehicles: A home is not counted. One vehicle per adult (up to two adults) and any income-producing vehicles are not counted. For all other vehicles, only the value exceeding $4,650 is counted.
Note: Court-ordered child support payments are excluded from gross income.
South Dakota SNAP Eligibility (Oct. 1, 2025 through Sept. 30, 2026)
Gross Monthly Income Limits (130% of FPL)
Household Size
Maximum Gross Monthly Income
1
$1,695
2
$2,291
3
$2,887
4
$3,482
5
$4,079
6
$4,674
Each Additional Member
+$595
Asset / Resource Limit
Household Type
Maximum Countable Assets
Elderly/Disabled Households
$4,500
All Other Households
$3,000
Extra Note on Elderly and Disabled
Gross Income Waiver: There is no gross income limit for households with a member who is age 60 or older or has a disability.
Net Income Test: These households must still meet the Net Income Test (100% of FPL).
Asset Limit: The asset limit for households with a member who is 60 or older or has a disability is $4,500.
Deductions: These households can deduct out-of-pocket medical expenses that exceed $35 per month. Alternatively, a standard medical deduction of $180 can be used if expenses exceed $35 (without full verification).
Vehicles: A home is not counted. One household vehicle and any income-producing vehicles are not counted. For all other vehicles, only the value exceeding $4,650 is counted.
Note: Court-ordered child support payments are excluded from gross income.
Tennessee SNAP Eligibility (Oct. 1, 2025 through Sept. 30, 2026)
Gross Monthly Income Limits (130% of FPL)
Household Size
Maximum Gross Monthly Income
1
$1,695
2
$2,291
3
$2,887
4
$3,482
5
$4,079
6
$4,674
Each Additional Member
+$595
Asset / Resource Limit
Household Type
Maximum Countable Assets
Elderly/Disabled Households
$4,500
All Other Households
$3,000
Extra Note on Elderly and Disabled
Gross Income Waiver: There is no gross income limit for households with a member who is age 60 or older or has a disability.
Net Income Test: These households must still meet the Net Income Test (100% of FPL).
Asset Limit: The asset limit for households with a member who is 60 or older or has a disability is $4,500.
Deductions: These households can deduct out-of-pocket medical expenses that exceed $35 per month.
Vehicles: A home is not counted. Most vehicles are not counted as resources, including those used for work or family transportation.
Note: Homes are not counted as resources/assets.
Texas SNAP Eligibility (Oct. 1, 2025 through Sept. 30, 2026)
Gross Monthly Income Limits (165% of FPL)
Household Size
Maximum Gross Monthly Income
1
$2,151
2
$2,908
3
$3,664
4
$4,420
5
$5,177
6
$5,933
Each Additional Member
+$755
Asset / Resource Limit
Household Type
Maximum Countable Assets
All Households
$5,000
Elderly/Disabled Households (Alternative Qual.)
$4,500
Extra Note on Elderly and Disabled
Gross Income Waiver: If a household member is age 60 or older or has a disability and their gross income is over the 165% FPL limit, the household can instead qualify by meeting the federal Net Income Test (100% FPL) and a federal Asset Test.
Asset Limit:
The standard asset limit for all households is $5,000.
If an elderly/disabled household is qualifying under the alternative federal rule, the asset limit is $4,500.
Deductions: These households can deduct out-of-pocket medical expenses that exceed $35 per month. Alternatively, a standard medical deduction of $135 can be used if expenses exceed $35 (without full verification).
Vehicles: A home is not counted. For the first vehicle, only the fair market value exceeding $22,500 is counted. For additional vehicles, the fair market value exceeding $8,700 per vehicle is counted. Income-producing vehicles are not counted.
Note: The Net Income limit for elderly/disabled households who did not pass the Gross Income test is $1,304 for 1 person (100% FPL).
Utah SNAP Eligibility (Oct. 1, 2025 through Sept. 30, 2026)
Gross Monthly Income Limits (130% of FPL)
Household Size
Maximum Gross Monthly Income
1
$1,695
2
$2,291
3
$2,887
4
$3,482
5
$4,079
6
$4,674
Each Additional Member
+$595
Asset / Resource Limit
Household Type
Maximum Countable Assets
Elderly/Disabled Households
$4,500
All Other Households
$3,000
Extra Note on Elderly and Disabled
Gross Income Waiver: There is no gross income limit for households with a member who is age 60 or older or has a disability.
Net Income Test: These households must still meet the Net Income Test (100% of FPL).
Asset Limit: The asset limit for households with a member who is 60 or older or has a disability is $4,500.
Deductions: These households can deduct out-of-pocket medical expenses that exceed $35 per month.
Vehicles: A home and vehicles are not counted as resources/assets.
Note: The Net Income limit for 1 person is $1,304 (100% FPL).
Virginia SNAP Eligibility (Oct. 1, 2025 through Sept. 30, 2026)
Gross Monthly Income Limits (200% of FPL)
Household Size
Maximum Gross Monthly Income
1
$2,608
2
$3,526
3
$4,442
4
$5,358
5
$6,276
6
$7,192
Each Additional Member
+$916
Asset / Resource Limit
Household Type
Maximum Countable Assets
All Households
No asset limit in Virginia.
Extra Note on Elderly and Disabled
Gross Income Waiver: If a household member is age 60 or older or has a disability, the household may still qualify even if their gross income exceeds the limit, provided they meet the federal Net Income and Asset tests.
Asset Limit (Alternative): If qualifying under the alternative federal rules mentioned above, the countable asset limit is $4,500.
Deductions: These households can deduct out-of-pocket medical expenses that exceed $35 per month. Alternatively, a standard medical deduction of $200 can be used.
Vehicles: A home and vehicles are not counted as resources/assets.
Note: Court-ordered child support payments are excluded from gross income.
The U.S. Virgin Islands SNAP Eligibility (Oct. 1, 2025 through Sept. 30, 2026)
Gross Monthly Income Limits
The income limit depends on the presence of elderly/disabled members:
Household Size
Max Gross Monthly Income (Standard – 175% of FPL)
Max Gross Monthly Income (Elderly/Disabled – 200% of FPL)
1
$2,282
$2,608
2
$3,085
$3,526
3
$3,886
$4,442
4
$4,688
$5,358
5
$5,491
$6,276
6
$6,293
$7,192
Each Additional Member
+$801
+$916
Asset / Resource Limit
Household Type
Maximum Countable Assets
All Households
No asset limit in the U.S. Virgin Islands.
Extra Note on Elderly and Disabled
Gross Income Tiers: Households with any member who is age 60 or older or has a disability can qualify using the higher 200% FPL limit (right column above).
Alternative Qualification: If their gross income is above the 200% FPL limit, they may still qualify by meeting the federal Net Income Test (100% FPL) and a federal Asset Test with a countable asset limit of $4,500.
Deductions: These households can deduct out-of-pocket medical expenses that exceed $35 per month.
Assets: A home and vehicles are not counted as resources/assets.
Note: All households must meet the Net Income Test (100% FPL) if their gross income is over 175% FPL.
Gross Income Waiver: If a household member is age 60 or older or has a disability, the household may still qualify even if their gross income exceeds the limit, provided they meet the federal Net Income and Asset tests.
Asset Limit (Alternative): If qualifying under the alternative federal rules mentioned above, the countable asset limit is $4,500.
Deductions: These households can deduct out-of-pocket medical expenses that exceed $35 per month. Alternatively, a standard medical deduction of $156 can be used.
Vehicles: A home is not counted. One vehicle per adult and any income-producing vehicles are not counted. For all other vehicles, only the value exceeding $4,650 is counted.
Note: Court-ordered child support payments are excluded from gross income.
Washington SNAP Eligibility (Oct. 1, 2025 through Sept. 30, 2026)
Gross Monthly Income Limits (200% of FPL)
Household Size
Maximum Gross Monthly Income
1
$2,608
2
$3,526
3
$4,442
4
$5,358
5
$6,276
6
$7,192
Each Additional Member
+$916
Asset / Resource Limit
Household Type
Maximum Countable Assets
All Households
No asset limit in Washington.
Extra Note on Elderly and Disabled
Gross Income Waiver: If a household member is age 60 or older or has a disability and their gross income is over the limit, the household may still qualify by meeting the federal Net Income and Asset tests.
Asset Limit (Alternative): If qualifying under the alternative federal rules mentioned above, the countable asset limit is $4,500.
Deductions: They can deduct out-of-pocket medical expenses that exceed $35 per month.
Vehicles: A home is not counted. Income-producing vehicles are not counted. For all other vehicles, count the value exceeding $4,650.
Note: Court-ordered child support payments are excluded from gross income.
Gross Income Waiver: If a household member is age 60 or older or has a disability and their gross income is over the limit, the household may still qualify by meeting the federal Net Income and Asset tests.
Asset Limit (Alternative): If qualifying under the alternative federal rules mentioned above, the countable asset limit is $4,500.
Deductions: These households can deduct out-of-pocket medical expenses that exceed $35 per month.
Vehicles: A home and vehicles are not counted as resources/assets.
Note: The Net Income limit for 1 person is $1,304 (100% FPL).
West Virginia SNAP Eligibility (Oct. 1, 2025 through Sept. 30, 2026)
Gross Monthly Income Limits (200% of FPL)
Household Size
Maximum Gross Monthly Income
1
$2,608
2
$3,526
3
$4,442
4
$5,358
5
$6,276
6
$7,192
Each Additional Member
+$916
Asset / Resource Limit
Household Type
Maximum Countable Assets
All Households
No asset limit in West Virginia.
Extra Note on the Elderly and Disabled
Gross Income Waiver: If a household member is age 60 or older or has a disability and their gross income is over the limit, the household may still qualify by meeting the federal Net Income and Asset tests.
Asset Limit (Alternative): If qualifying under the alternative federal rules mentioned above, the countable asset limit is $4,500.
Deductions: These households can deduct out-of-pocket medical expenses that exceed $35 per month.
Vehicles: A home and vehicles are not counted as resources/assets.
Note: The Net Income limit for 1 person is $1,304 (100% FPL).
Wyoming SNAP Eligibility (Oct. 1, 2025, through Sept. 30, 2026)
Gross Monthly Income Limits (130% of FPL)
Household Size
Maximum Gross Monthly Income
1
$1,695
2
$2,291
3
$2,887
4
$3,482
5
$4,079
6
$4,674
Each Additional Member
+$595
Asset / Resource Limit
Household Type
Maximum Countable Assets
Elderly/Disabled Households
$4,500
All Other Households
$3,000
Extra Note on Elderly and Disabled
Gross Income Waiver: There is no gross income limit for households with a household member who is age 60 or older or has a disability.
Net Income Test: These households must still meet the Net Income Test (100% of FPL).
Asset Limit: The asset limit for households with a member who is 60 or older or has a disability is $4,500.
Deductions: These households can deduct out-of-pocket medical expenses that exceed $35 per month. Alternatively, a standard medical deduction of $138 can be used.
Vehicles: A home and vehicles are not counted as resources/assets.
Note: The Net Income limit for 1 person is $1,304 (100% FPL).
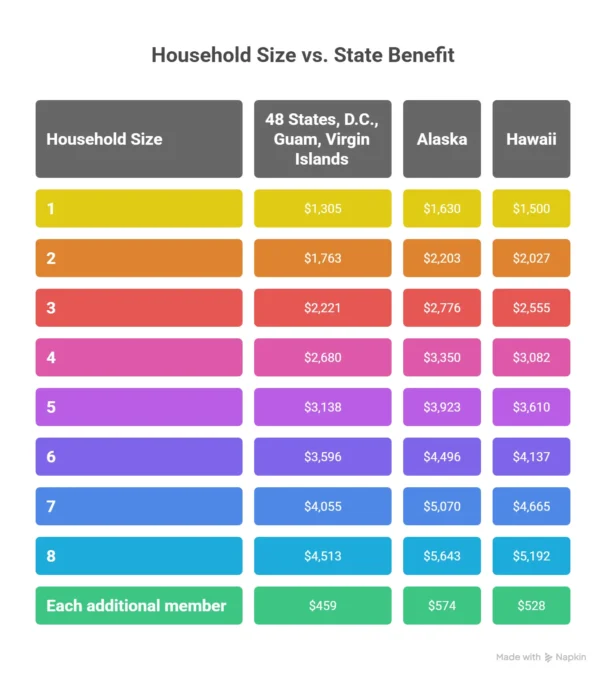
Net Income Limits (100% Poverty Level) FY2026
Household Size
48 States, D.C., Guam, Virgin Islands
Alaska
Hawaii
1
$1,305
$1,630
$1,500
2
$1,763
$2,203
$2,027
3
$2,221
$2,776
$2,555
4
$2,680
$3,350
$3,082
5
$3,138
$3,923
$3,610
6
$3,596
$4,496
$4,137
7
$4,055
$5,070
$4,665
8
$4,513
$5,643
$5,192
Each additional member
$459
$574
$528
Special Rules for Elderly/Disabled Households
Households with elderly (60+) or disabled members have higher gross income limits at 165% of poverty level but must still meet net income requirements. These households also benefit from no gross income test if they meet net income standards.
Enhanced Deductions for 2026
SNAP deductions reduce your countable income, potentially making you eligible even with higher gross income. Here are the updated deduction amounts:
Standard Deductions
The standard deduction applies to all households automatically:
Area
Household Size 1-2
Size 3
Size 4
Size 5
Size 6+
48 States & D.C.
$209
$209
$223
$261
$299
Alaska
$358
$358
$358
$358
$374
Hawaii
$295
$295
$295
$300
$344
Guam
$420
$420
$445
$522
$598
Virgin Islands
$184
$185
$223
$261
$299
Maximum Shelter Deductions
Key shelter deduction caps for 2026:
48 States & D.C.: $744 (increased from previous year)
Alaska: $1,189
Hawaii: $1,003
Guam: $873
Virgin Islands: $586
What counts as shelter costs:
Rent or mortgage payments
Property taxes
Homeowners/renters insurance
Basic utility costs
Trash removal
Homeless Shelter Deduction
All areas now have a standardized homeless shelter deduction of $198.99 per month for households without fixed housing.
Other Important Deductions
Medical expenses for elderly/disabled members exceeding $35/month
Dependent care costs necessary for work or training
Child support payments to non-household members
Earned income deduction of 20% of gross earned income
Maximum SNAP Allotments for 2026
Your SNAP benefits are calculated based on the maximum allotment for your household size, minus your expected contribution (30% of net income).
48 States and D.C. Maximum Allotments
Household Size
Maximum Monthly Benefit
1 person
$298
2 people
$546
3 people
$785
4 people
$994
5 people
$1,183
6 people
$1,421
7 people
$1,571
8 people
$1,789
Each additional person
+$218
Alaska Maximum Allotments
Alaska has three different benefit levels based on location:
Household Size
Urban
Rural 1
Rural 2
1 person
$385
$491
$598
2 people
$707
$901
$1,097
4 people
$1,285
$1,639
$1,995
8 people
$2,314
$2,950
$3,591
Other Territory Maximum Allotments
Hawaii: Up to $1,689 for a 4-person household Guam: Up to $1,465 for a 4-person household Virgin Islands: Up to $1,278 for a 4-person household
Asset Limits & Other Requirements
Resource Limits (Unchanged for 2026)
Most households: $3,000 in countable resources
Elderly/disabled households: $4,500 in countable resources
Countable resources include:
Cash and money in checking/savings accounts
Vehicles worth over $4,650 (with exceptions)
Property other than your home
Excluded resources:
Your home and surrounding property
One vehicle per household (or vehicles under $4,650)
Retirement accounts (401k, IRA)
Life insurance policies
Burial plots and funeral funds up to $1,500 per person
Work Requirements
Able-bodied adults without dependents (ABAWDs) ages 18-49 must:
Work at least 20 hours per week, OR
Participate in qualifying education/training programs, OR
Online applications are available in most states through state SNAP websites or benefits portals. In-person applications can be submitted at local SNAP offices, and phone applications are accepted in many states.
Required Documentation
Proof of identity: Driver’s license, state ID, or passport Income verification: Pay stubs, employer statement, or benefit award letters Resource documentation: Bank statements, vehicle registration Residence proof: Utility bills, lease agreement, or mail Immigration status: For non-citizens, provide immigration documents
Application Timeline
Initial application processing: 30 days maximum
Expedited service: 7 days for emergency cases
Interview requirement: Most states require phone or in-person interview
Recertification: Every 6-24 months depending on household circumstances
Real-World Eligibility Examples
Example 1: Single Parent with Two Children
Household details:
1 adult, 2 children (3-person household)
Monthly gross income: $2,500
Rent: $800, Utilities: $150
No other deductions
This example reflects typical costs in states like Ohio or Pennsylvania.
For most states, a family of four can have gross monthly income up to $3,483 and still qualify for SNAP. Alaska and Hawaii have higher limits due to increased living costs. Net income after deductions must be below $2,680 for a four-person household.
2. How much will SNAP benefits increase in 2026?
Maximum SNAP benefits for a family of four increased to $994 per month in most states. Alaska families can receive up to $1,995 monthly depending on location. Use our benefit calculator to estimate your specific benefit amount.
3. Do asset limits change for SNAP in 2026?
No, asset limits remain unchanged at $3,000 for most households and $4,500 for households with elderly or disabled members. Your home, one vehicle, and retirement accounts don’t count toward these limits.
4. Can college students get SNAP benefits in 2026?
College students generally cannot receive SNAP unless they meet specific exemptions like working 20+ hours weekly, caring for dependents, or participating in work-study programs. Students in vocational training programs may qualify more easily.
5. How often do I need to recertify for SNAP?
Most households recertify every 12 months, but elderly or disabled households may have longer certification periods up to 24 months. You’ll receive notice 30 days before your certification expires with instructions for renewal.
6. What happens if my income changes during the year?
You must report income changes that exceed $125 monthly within 10 days. Some changes may increase your benefits, while others might reduce them. Failure to report changes can result in overpayments that must be repaid.
This guide reflects official USDA SNAP income limits and benefit amounts effective October 1, 2025, through September 30, 2026. Contact your local SNAP office for personalized eligibility determination and application assistance.